Market Share is one of the most defining metrics in the business world – but it relies on knowing your competitors’ turnover.
Now, for FMCG’s this is easy, as many of their competitors are publicly traded and therefore have to report earnings. However, for mid-sized companies, getting this market share information can be very difficult, expensive and time-consuming. Enter Share of Search (SoS) as the new, digital way to estimate (future) market share.
What is Share of Search?
Share of Search is a 12 month moving average of the searches on a brand’s name compared to the same 12 month moving average of all the brands in the same sector. In layman’s terms, “how well is my brand doing in comparison to my competitor brands”.
So what?
Now, in and of itself, ‘how many people are searching for my brand versus others’ is interesting, but it’s not groundbreaking. What’s really interesting is how well this metric maps onto market share. When you carry out this analysis for Fortune 500 companies whose market shares are well published, you find a strong correlation between the metrics. To be precise, Share of Search acts as a leading indicator of market share. If your share of search is higher than your market share, usually your market share (eventually) rises to match and vice versa (watch this introductory talk from 2020 for more details).
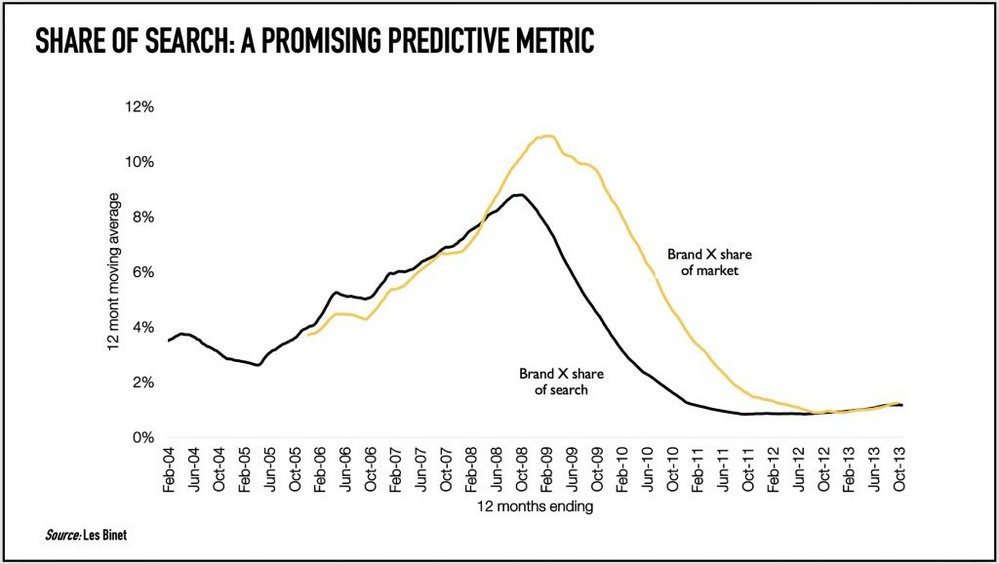
Now, at this point, it’s important to state that no-one is saying that having a high level of brand searches causes you to increase your market share. Or indeed that you should target growing your brand searches. Instead, what this research implies is that when you are doing ‘good’ marketing activities – the kind of things that will improve your market share – the number of people searching for you also increases in step.
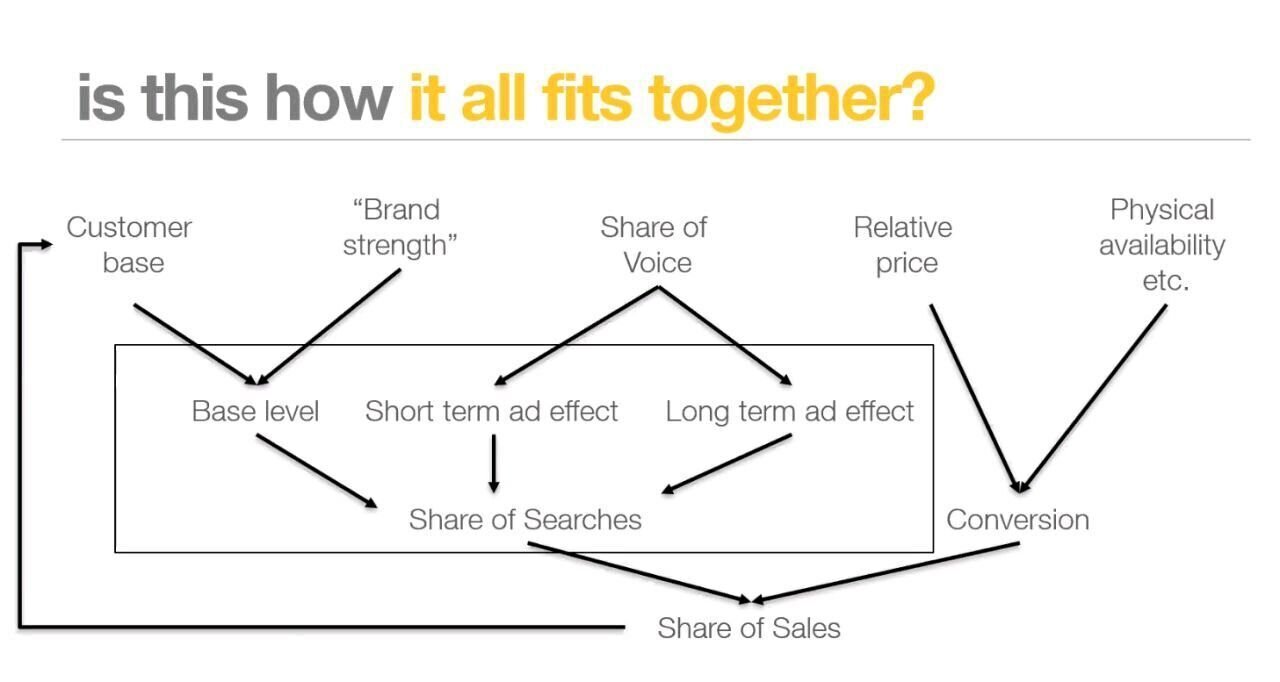
How to use Share of Search
Share of Search is a strategic tool, not a tactical one. If you’re one month into your campaign and are considering whether you want to change your targeting demographics then SoS can’t help you. Instead, Share of Search is about looking at the big picture, the long term, the whole shebang. The best way to explain it is to look at some examples of how we’ve used it.
Case Study 1 – To Demonstrate Progress
One of the first ideas we had for Share of Search was if we could use it to measure the impact of brand awareness campaigns. Typically, you have to report on clicks, impressions and engagement. However, those aren’t really the main purpose of the campaign. You’re really trying to improve brand salience and brand sentiment – the exact type of thing that SoS is great for.
Therefore we carried out a Share of Search analysis for one of our large, well-established clients as part of a post-campaign analysis to see if we actually had shifted the needle at all.
In this instance, this generally this looks like quite a stable SoS, with very little movement being seen; this is to be expected of a £6bn extremely mature market – no-one’s gone bust and no new challengers have arisen. So let’s zoom in on just our client.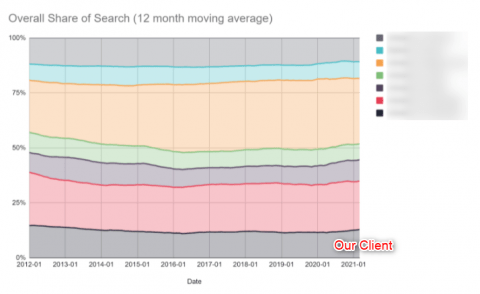 In the graph below, we see that our client had a period of decline from 2012 to 2016, then held stable, and has just recently seen an uptick.
 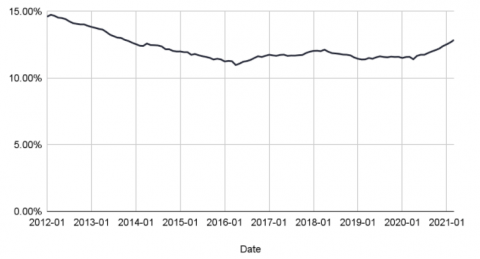 If we then compare each month to the previous year, we can quantify when and where that success has come. Here we see that the growth from the end of 2020 into Q1 2021 is the largest growth this client has seen in the last 9 years.
 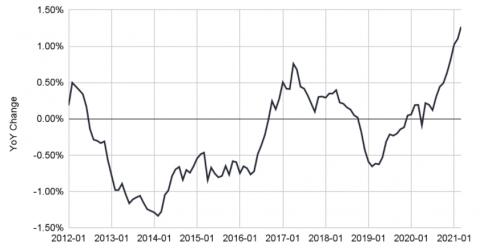 It’s always important to remember with SoS is that you’re reporting on company-wide big metrics here, so there are thousands of inputs. Having said that, if the SoS goes up in a period when you’ve been launching a large brand awareness campaign, it’s a pretty good indicator that it was a successful one.
Case Study 2 – Galvanise Activity
On the other hand, sometimes you just need to do a strategy reset and work out where you actually sit in the market. For this client, we carried out a sitrep (situation report) for them across multiple Scandinavian countries. 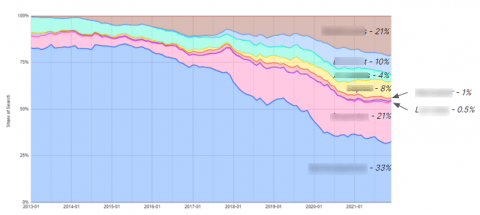
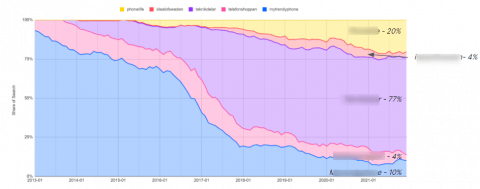 From here we saw a worrying picture of decline across the majority of the countries, where the client had been unseated from the top position and overtaken by challenger brands almost across the board. We were able to use this as evidence that they needed to change their strategy of focusing on squeezing the sponge of that juicy bottom of funnel and instead prioritise securing that brand salience. Indeed, generally this analysis was a bit of a wake up call for them that action needed to be taken and soon.
Summary
Share of Search is a quick and easy strategic tool that you should have in your metric wheelhouse. It doesn’t solve everything and there’s every chance that many times you’ll likely look at it and see no interesting story as everything proceeds as expected. However, it enables you to take a look at the wider market and how you sit in it: these are insights that you just cannot be ignoring if you want to be strategic with your marketing.


