With budget season firmly upon us, we’ve pulled together the evidence that marketers can take to their finance team to make the case for marketing in a recession.
You may have heard the rule of thumb that companies should be investing between 5% and 10% of their revenue on marketing.
Depending on your organisation, that may be an ambitious figure at the best of times, much less in the unstable economic situation we find ourselves in now.
There is plenty of evidence that shows continuing to invest in marketing during an economic downturn can lead to a stronger recovery and growth in market share.
We agree that this is the right course of action in most cases, but as with any blanket statement, it needs to be examined against your reality. If your category is declining or will come to a sudden halt – like some did during the pandemic – it may be smarter to bide your time.
However, most brands will need to continue to invest in marketing that – at the very least – keeps the lights on and ensures that people who are still in-market for your products can find you.
With budget season firmly upon us, we have pulled together some evidence you can take to your finance team to make the case for marketing in a recession.
Q1: How do I benchmark my budgets against those of peers and competitors?
Marketing is an essential part of every organisation, one that helps create long-term sustainable demand for your products or services as well as convert existing demand into immediate revenue. But how do you know if you’re spending the right amount?
By benchmarking how much you spend on marketing compared to other companies in your industry, you’ll be able to spot trends before they trip you up and even provide you with the information you need to stay competitive.
If your CFO wants to cut budgets in a way that would put you at a disadvantage compared to your competitors, having the numbers to back up your argument may help you protect much-needed resources.
It’s not always easy to find granular data about how much your competitors are spending, but larger players like Gartner and Deloitte publish annual spend surveys that can give you a fairly good idea of what’s happening in the broader marketplace.
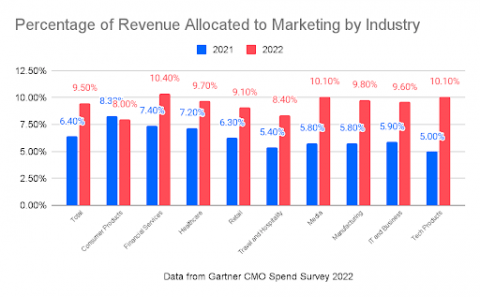
In their latest CMO Spend Survey, Gartner found that marketing budgets started to climb back from 6.9% (in the depths of COVID) to 9.5% (not yet back to their pre-pandemic levels).
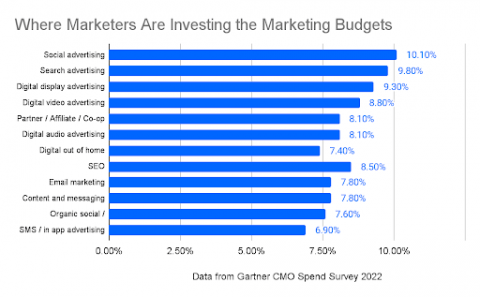
The chart below shows the percentage of revenue allocated to marketing by industry.  When they looked in detail at which channels marketers are investing their budgets in, social, search and display advertising were in the top spots. SEO was the top organic channel where marketers were spending, followed by email and content marketing.
  When it comes to investing in digital channels, this did vary by industry. Manufacturing showed a clear preference for digital audio advertising while CPG invested heavily in social media. IT and Business Services prioritised digital video advertising while tech products focused more on search advertising.
Marketing budget allocation across digital channels
| Financial Services | Healthcare | Tech Products | Manufacturing | Consumer Products | Media | Retail | IT and Business Services | Travel and Hospitality | |
| Email marketing | 10.90% | 7.60% | 8.00% | 4.40% | 6.30% | 8.00% | 8.00% | 7.20% | 8.30% |
| Social advertising | 10.60% | 9.60% | 10.50% | 9.90% | 12.00% | 8.30% | 11.20% | 11.30% | 7.60% |
| Search advertising | 10.00% | 9.90% | 11.70% | 9.00% | 10.60% | 8.60% | 10.10% | 10.30% | 7.60% |
| Organic social / influencer | 9.40% | 7.20% | 6.20% | 5.90% | 7.20% | 8.10% | 7.10% | 8.10% | 8.70% |
| SEO | 8.60% | 9.00% | 10.60% | 8.40% | 8.30% | 7.20% | 8.80% | 9.10% | 6.00% |
| Partner / Affiliate / Co-op | 8.20% | 7.90% | 6.60% | 8.90% | 9.10% | 9.30% | 7.50% | 6.10% | 8.90% |
| Digital display advertising | 8.10% | 8.80% | 11.00% | 8.30% | 9.90% | 8.80% | 9.50% | 11.00% | 9.60% |
| Content and messaging | 7.30% | 8.10% | 8.00% | 8.20% | 7.10% | 8.00% | 8.30% | 7.00% | 7.70% |
| Digital audio advertising | 7.30% | 8.90% | 6.00% | 11.00% | 5.20% | 8.80% | 8.60% | 7.30% | 9.30% |
| Digital video advertising | 7.00% | 8.90% | 7.80% | 9.20% | 9.30% | 7.90% | 7.50% | 13.10% | 9.90% |
| Digital out of home | 6.70% | 7.50% | 5.90% | 9.10% | 9.10% | 7.50% | 6.90% | 4.90% | 8.60% |
| SMS / in app advertising | 5.80% | 6.80% | 7.70% | 7.70% | 5.70% | 9.30% | 6.80% | 4.70% | 7.80% |
Q2: How do I understand the impact of the economic headwinds on the behaviours and attitudes of consumers and customers?
The current economic situation is different from the financial crisis of 2008 and different again from the sudden impact of COVID-19. High inflation, high interest rates, an energy crisis and continued challenges with supply chains has knocked consumer confidence in countries around the world. In the UK, each month seems to bring record lows.
Your customers are likely facing cost of living increases, uncertainty at home and at work and may be under additional stress. With everything that’s going on, they may be less receptive to marketing.
However, brands who strive to understand what’s happening in their customers’ lives and are able to adapt their products or services to meet the changing reality have a chance of deepening trust and brand affinity.
This will only happen through customer research. Running qualitative interviews or small focus groups will help you uncover important themes, challenges and potential solutions. Following that up with quantitative research, like surveys, can help you validate hypotheses raised in qualitative research.
Customer research isn’t a magic bullet – we know that customers don’t always know their own minds or motivations. But some research is better than no research at all, and you can take the insights you find and test them in a series of activities to help your brand navigate the current environment.
Q3: How do I prove the value of marketing investments so I can minimise the impact of enterprise budget cuts on marketing?
We know that marketing is particularly vulnerable to budget cuts when the economy starts to contract. Marketing can feel like a luxury – a discretionary activity that isn’t contributing to the bottom line. In the short term, cutting off marketing budgets and saving those costs may improve net profit. But the long-term impact of that can be significant and damaging.
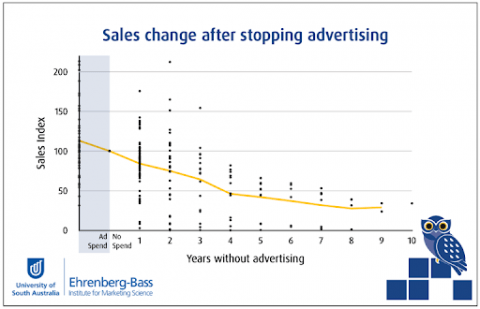
A report by the Ehrenberg-Bass Institute found that companies that paused their advertising for a year experienced a decline in sales – on average a 16% drop. The research also found that it may take longer than a year of spend to make up for that pause.
“While it may be tempting to withdraw the advertising budget for a boost in profits, the evidence suggests that doing so risks putting the brand on a downward sales trajectory. Without refreshment, mental availability erodes.” (Ehrenberg-Bass Institute)

In contrast, McGraw-Hill research from past recessions concluded that B2B companies that kept up their advertising saw a sales increase of 256% over companies that didn’t.
Multiple studies from around the world and across a number of different recessionary periods all point to the same finding: companies who invest in marketing during a downturn have superior growth once the recession ends.
Committing to this course of action even when things get tight requires a strong will and a long-term vision. You will feel the squeeze and you will likely not see immediate positive results. But as the recession eases and customers start to buy again, you will reap outsized rewards.
To help protect your marketing budgets and justify continued investment, you need to link marketing performance to business outcomes, using the language of the finance department.
Ensure your marketing team is clear on the most important business objectives – examples might be revenue growth, new customer acquisition, customer retention or cost optimisation. Next, identify the metrics linked to your marketing activity that ties to at least one of the objectives and create a dashboard to circulate with senior leadership.
Gartner recommends including leading, lagging and operational indicators on your dashboard to provide a holistic view of the marketplace and how marketing can influence each one.
- Leading indicators indicate sentiment toward future action; examples include Net Promoter Score, brand recognition, content or app downloads, requests for information, etc.
- Lagging indicators show quantitative results from action; examples include cost per acquisition, average order value, engagement rates, sales conversion rates, marketing-source pipeline, etc.
- Operational indicators demonstrate performance of action and efficiency; examples include open rates, response rates, bounce rates, page visits, time spent on site, event registrations, etc.
Les Binet agrees with the need for long data – metrics you track over two or three years to see fluctuations in the strength of your brand and the impact that marketing investment can have on the bottom line. In a conversation with WARC, Binet recommends marketers be able to answer questions like the following:
- What is the base-level of your sales when you’re not on promotion? How reliant are you on discounts?
- How sensitive are your customers to price increases?
- How many of your customers are coming to you through brand searches as opposed to paid search or display?
- How much of your website traffic is direct rather than paid or referral?
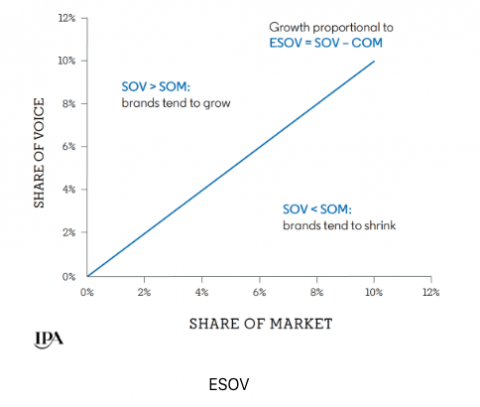
One final point to communicate to senior leaders is that when competitors cut their marketing costs, you may be able to get a better return on your continued investment. You’ll want to review the cost per reach and cost per acquisition to see if they’re getting cheaper. In a situation like that, it would make sense to increase your budgets rather than cut them. This is because of the correlation between share of voice (the percentage of category advertising expenditure spent by the brand) and market share. Cutting advertising spend will lead to a loss of market share that – as we’ve seen above – can be expensive and take a long time to recover from.
But spending more than your competitors (ie. investing in an excess share of voice), means you are likely to grow your market share at a reduced cost.
 Q4: How do I define the marketing costs I can afford to cut and those I can’t afford to lose?
Despite your best efforts to demonstrate the value of your marketing activity, the decision may come down from on high that you have to make cuts. So how do you know which activities you can afford to stop and which ones are essential to your long-term growth?
Base your decisions on ROI
Start with a quick marketing audit. Document all the marketing and advertising activity you’re currently doing and how much you’re spending on it. Include direct costs to the business (partner fees, advertising spend) as well as indirect costs (tools, subscriptions) and internal labour costs.
Next, establish the value that you’re getting from each activity. What is the return on your investment? Look for the activities that generate the most profit in actual terms as well as a percentage of the amount you’ve invested. And try to consider the long-term impact of each activity – SEO may require an upfront investment, but its long-term payoff can be huge.
Once you can see what is and isn’t working for you, you should be able to make some decisions about what activity you can cut out entirely, pause until things improve or modify the investment to balance out the returns you’re seeing.
Balance the Long and Short
One of our recommendations to companies is to find the right balance between brand building activity and sales activation. In an economic recession, it’s important to understand changes in customer behaviour. If your customers have stopped buying, or if they have switched to a more affordable alternative, you may want to consider stopping – or at least reducing – your investment in short-term sales activation.
When existing demand dries up, that’s the time to invest in brand building to drive mental availability – ensuring a customer is not only aware of a brand’s existence but also knows what it does and what it stands for. That doesn’t happen automatically and it can’t be achieved overnight.
Building mental availability and linking your brand to buying triggers is the work of long-term brand building.
This is important because research from LinkedIn’s B2B Institute and the Ehrenberg-Bass Institute shows that up to 95% of customers are not ‘in-market’ to buy your product right now. Of course, this will flex depending on your category and purchasing cadence but the principle holds true – there will always be more people in the category who are not ready to buy than those who are ready to buy.
So allocating the bulk of your budget and effort to convert that 5% today isn’t going to get you the long-term growth you want. You need to be talking to those 95% so that when they’re ready to buy, your brand will be one of the ones they consider.
There is also tangible value in investing in future demand. The 2021 Nielsen Brand Resonance Report that found “increasing awareness and consideration by one point drives a 1% increase in future sales. And increasing awareness and consideration by 1% can decrease short-term cost per acquisition by 1%.”
So once the economy improves, the groundwork you’ve laid through your brand building will make your sales activation work harder and be more cost effective.
How Hallam can help
In an uncertain and volatile marketplace, it’s important to read the signals and make the first move rather than react to changing events. There are a few different ways we can help.
If you’d like to speak with one of our experts about your marketing budgets and what the optimum split would be for you, we can arrange a call with our strategists and channel experts to discuss. And, if you need help making a business case for marketing to present to your board, we can help with that too.
Our strategy team can do a listening tour with your key audiences to understand what’s changing in their world, what choices they’re needed to make and how your brand could be part of the solution.
If you need help proving the value of your marketing investment, we can work with you to tie your marketing activity to business outcomes and create a dashboard that pulls together the key metrics senior leadership care about.
We can also help you review the return on your marketing spend and make recommendations around how to flex it to get the most cost-effective results.
Whether you want to audit your marketing activity or want to prove the return on your current investments, our team is here to help. We can also review how your budgets are split between brand building and sales activation and make recommendations on whether things need to be rebalanced.


