JavaScript is present everywhere on the web. Since HTML and CSS are static in nature, JavaScript has been widely adopted to provide dynamic functionality on the client-side, which is just a fancy way of saying it’s downloaded and run within a browser.
Demands of the language are high, with countless frameworks/libraries and other variations all in rapid development. It’s therefore common – and was perhaps inevitable – that the technology regularly outpaces search engine support and, by extension, best practice in the SEO space. You need to be mindful before auditing JavaScript that there are common issues that are likely to occur and compromises you will have to make in order to satisfy all needs.
We’ve broken down our JavaScript auditing process into five key areas, allowing you to determine:
- Whether a site relies heavily on JavaScript
- Whether JavaScript assets are being cached/updated appropriately
- What impact is JavaScript having on site performance
- Whether JavaScript files are being fetched correctly and efficiently
- Situational JavaScript issues: infinite scroll routing and redirects
But before we dive into it…
A quick 101 on website structure
Current websites are made up of three main technologies:
Hyper-text markup language (HTML)
This is the structure on which everything else rests, with a hierarchy of elements representing everything from generic containers to text, links, media, and metadata.
It’s simple, robust, and semantically focused to enable a wide range of applications.
Although browsers will format raw HTML sensibly, presentation is better handled by…
Cascading style sheets (CSS)
This is the presentation layer where HTML can be styled and rearranged in a variety of ways.
Any HTML element can be targeted, moved, coloured, resized, and even animated. In effect, this is the realisation of website design.
However, with the exception of some limited features it remains static, bringing us to…
JavaScript (JS)
This is the dynamic layer which can actively manipulate HTML and CSS in response to events like user interaction, time, or server changes. This massively opens up what can be achieved in terms of user experience.
When you visit a website, your browser downloads the HTML file and then reads it, interpreting and executing each part one after the other. External assets (CSS/JS/media/fonts) are downloaded and elements are pieced together according to the associated directives and instructions.
This process of bringing together the building blocks of a website to produce the final result is called rendering. This is highly relevant to SEO because Google will do something similar to browsers (with some extra analysis steps) and take this into consideration when ranking. In effect, Google attempts to replicate the user’s experience.
How does Google handle JavaScript?
Google will render JavaScript. In other words, it will load your JavaScript assets along with HTML and CSS to better understand what users will see, but there are two basic considerations:
- Google wants to use as few resources as possible to crawl sites.
- More JavaScript means that more resources are needed to render.
Because of these issues, Google’s web rendering service is geared towards working as efficiently as possible, and so adopts the following strategies:
- Googlebot will always render a page that it’s crawling for the first time. At this point it makes a decision about whether it needs to render that page in future. This will impact how often the page is rendered on future crawls.
- Resources are analysed to identify anything that doesn’t contribute to essential page content. These resources might not be fetched.
- Resources are aggressively cached to reduce network requests, so updated resources may be ignored initially.
- State is not retained from one page to the next during crawl (e.g. cookies are not stored, each page is a “fresh” visit).
The main point here is that overall, Google will take longer to index content that is rendered through JavaScript, and may occasionally miss things altogether.
So, how much important content is being affected? When something is changed, how long does it take to be reflected in SERPs? Keep questions like this in mind throughout the audit.
A five-step guide to a JavaScript SEO audit
Everyone will have their own unique way to carry out a JavaScript SEO audit, but if you’re not sure where to begin or you think you’re missing a few steps from your current process, then read on.
1. Understand how reliant on JavaScript a site is
Initially, it’s important to determine whether the site relies heavily on JavaScript and if so, to what extent? This will help steer how deep your subsequent analysis should be.
This can be achieved via several methods:
- What Would JavaScript Do?
- Disable JavaScript locally via Chrome
- Manually check in Chrome
- Wappalyzer
- Screaming Frog
What Would JavaScript Do (WWJSD)
A tool provided by Onely which provides straightforward, side-by-side comparisons of a URL by presenting screenshots of HTML, meta tags, and links, with and without JavaScript.
 Consider carefully whether you want to check mobile or desktop. Although mobile-first principles generally apply, JavaScript tends to be used more as part of a desktop experience. But ideally if you’ve got the time, test both!
Steps for analysing Javascript use in WWJSD:
- Visit WWJSD
- Choose mobile or desktop
- Enter URL
- Submit form
Disable locally via Chrome
Chrome browser allows you to disable any JavaScript in-place and test directly:
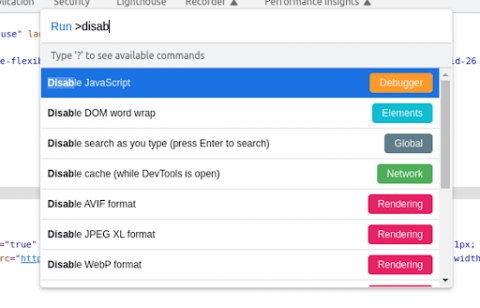 Steps for analysing JavaScript use using Chrome:
- Press F12 to open devtools and select Elements tab if not already open
- Cmd+Shift+P (or Ctrl+Shift+P)
- Type “disable” and select *Disable JavaScript*
- Refresh the page
- Don’t forget to re enable
Manually check in Chrome
There are two ways to check source HTML in Chrome as they provide slightly different results.
Viewing source will display the HTML as initially received, whilst inspecting source takes dynamic changes into effect – anything added by JavaScript will be apparent.
Viewing source:  Inspecting source:
 This is best used as a quick way to check for a full JavaScript framework. The initial source download will be shorter and likely missing most content, but inspector will be fuller.
Try searching in both for some text that you suspect is dynamically loaded – content or navigation headers are usually best.
Steps for manually analysing JavaScript use using Chrome:
View source:
- Right click in browser viewport
- Select View Source
Inspect source:
- Press F12 to open devtools
- Select Elements tab if not already open
Wappalyzer
This is a tool that provides a breakdown of the technology stack behind a site. There’s usually a fair amount of info but we’re specifically looking for JavaScript frameworks:
 Steps for using Wappalyzer to analyse JavaScript use
- Install the Wappalyzer Chrome extension
- Visit the site you want to inspect
- Click the Wappalyzer icon and review the output
⚠️ Be aware that just because something isn’t listed here, it doesn’t confirm 100% that it isn’t being used!
Wappalyzer relies on fingerprinting to identify a framework. That is, finding identifiers and patterns unique to that framework.
If any effort has been taken to change those, Wappalyzer will not identify the framework. There are other ways to confirm this which are beyond the scope of this document. Ask a dev.
Screaming Frog
This is a deep-dive of JavaScript visibility checking. With JavaScript rendering enabled, Screaming Frog can provide a comprehensive breakdown of the impact of JavaScript on a crawled site, including rendered content/link coverage and potential issues.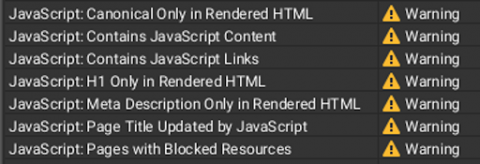 Steps for using Screaming Frog to analyse Javascript issues:
- Head to the Configuration menu
- Select *Spider*
- Select Rendering tab
- Choose JavaScript from the dropdown
- (optional) Reduce AJAX timeout and untick to improve crawl performance if struggling
2.Use a forced cache refresh
Caching is a process that allows websites to be loaded more efficiently. When you initially visit a URL, all the assets required are stored in various places, such as your browser or hosting server. This means that instead of rebuilding pages from scratch upon every visit, the last known version of a page is stored for faster subsequent visits.
When a JavaScript file has been updated, you don’t want the cached version to be used. Google also caches quite aggressively so this is particularly important to ensure that the most up to date version of your website is being rendered.
There are a few ways to deal with this, such as adding an expiration date to the cached file, but generally the best “on demand” solution is to use a forced cache refresh.
The principle is simple: say you have a JavaScript file called ‘main.js’ which contains the bulk of the JavaScript for the site. If this file is cached, Google will use that version and ignore any updates; at best, the rendered page will be outdated; at worst, it’ll be broken.
Best practice is to change the filename to distinguish it from the previous version. This usually entails some kind of version number or generating a code by fingerprinting the file.
To achieve this, there are two strategies:
- A couple of files with the ‘Last Updated’ timestamp appended as a URL variable.
- A unique code being used in the filename itself – ‘filename.code.js’ is a common pattern like below:
 Steps to follow:
- Press F12 to load Chrome devtools
- Go to the ‘Network’ tab
- Apply filters
- In the *Filter* field, filter for the main domain like so: `domain:*.website.com`
- Click the JS filter to exclude non-JS files
- Review the file list and evaluate – seek dev assistance if required
⚠️ Although the relevant JavaScript files are normally found on the main domain, in some cases they may be hosted externally, such as on a content delivery network (CDN).
On WP Engine hosted sites you may need to filter for ‘*.wpenginepowered.com’ instead of the main domain, per the above example. There are no hard and fast rules here – review the domains in the (unfiltered) JS list and use your best judgement. An example of what you might see is: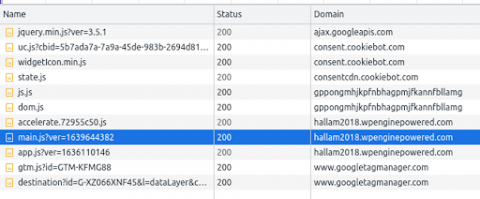 If the Domain column isn’t visible, right-click an existing column header and select Domain.
3. Identify what impact JS has on site performance
When it comes to site performance, there are a few things to watch out for.
Processing time
This ties into Core Web Vitals (CWV), some of which are represented in the timings visualisation below, which looks at metrics like largest contentful pain (LCP), cumulative layout shift (CLS) and first input delay (FID).
Specifically, you’re interested in the loading and scripting times in the summary. If these are excessive it’s possibly a sign of large and/or inefficient scripts.
The waterfall view also provides a useful visualisation of the impact each CWV has, as well as other components of the site.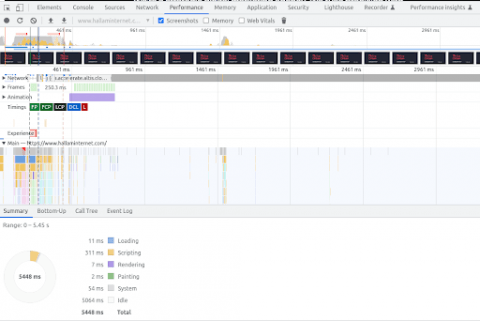 Steps:
- Press F12 to open Chrome devtools
- Go to the ‘Performance’ tab
- Click the refresh button in the panel
- Review the Summary tab (or Bottom Up if you want to deep dive)
Compression
This is a simple check but an important one; it ensures that files are efficiently served.
A properly configured host will compress site assets so they can be downloaded by browsers as quickly as possible. Network speed is often the most significant (and variable) chokepoint of site loading time. Steps:
- Press F12 to open Chrome devtools
- Go to the ‘Network’ tab
- Apply filters
- In the ‘Filter’ field, filter for the main domain like so: `domain:*.website.com`
- Click the JS filter to exclude non-JS files
- Review the content of the ‘Content-Encoding’ column. If it reads ‘gzip’, ‘compress’, ‘deflate’, or ‘br’, then compression is being applied.
ℹ️ If the content-encoding column isn’t visible:
- Right-click on an existing column
- Hover over ‘Response Headers’
- Click ‘Content Encoding’
- Coverage
An increase in feature-packed asset frameworks (e.g. Bootstrap, Foundation, or Tailwind) makes for faster development but can also lead to large chunks of JavaScript that aren’t actually used.
This check helps visualise how much of each file is not actually being used on the current URL.
⚠️ Be aware that unused JavaScript on one page may be used on others! This is intended for guidance mainly, indicating an opportunity for optimisation. Steps:
- Press F12 to open Chrome devtools
- Cmd+Shift+P (or Ctrl+Shift+P)
- Click ‘Show Coverage’
- Click the refresh button in the panel
- Apply filters
- In the *Filter* field, filter for the main domain. No wildcards here; ‘website.com’ will do.
- Select JavaScript from the dropdown next to the filter input
Minification
JavaScript is initially written in a human-readable way, with formatting and terms that are easy to reason about. Computers don’t care about this – they interpret a whole file as a single line of code and don’t care what things are called as long as they’re referenced consistently.
It’s therefore good to squish files down to the smallest size possible. This is called minification and is common practice, but still occasionally missed.
Spotting the differences is trivial: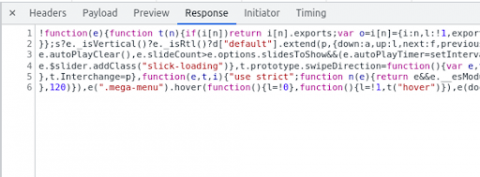 ^ Minified = good!
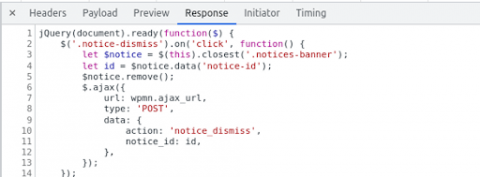 ^ Not minified = not good!
ℹ️ This mainly applies to sites in PRODUCTION. Sites in development/testing tend to have unminified files to make bugs easier to find.
Steps:
- Press F12 to open Chrome devtools
- Go to the ‘Network’ tab
- Apply filters
- In the ‘Filter’ field, filter for the main domain like so: domain:*.website.com
- Click the JS filter to exclude non-JS files
- Check each file
- Click on the file name
- Go to the ‘Response’ tab on the panel that appears
Bundling
Multiple JavaScript files can be bundled into fewer files (or one!) to reduce the number of network requests. Essentially, the more JavaScript files being pulled in from the main domain, the less likely it is that this approach is being used.
This isn’t really a dealbreaker most of the time, but the more severe the number of separate JavaScript files, the more time can be saved by bundling them.
Note that WordPress in particular encourages files to be loaded by plugins as and when required, which might result in some pages loading lots of JavaScript files and others very few. So this is more of an opportunity exercise than anything.
Steps:
- Repeat steps 1-3 from minification
- Note how many files are present – one to three is generally a good sign
4. Understand whether JavaScript files are being fetched correctly and efficiently
There are a couple of things to have a look at.
Resource blocked by robots.txt
JavaScript files blocked in robots.txt will not be fetched by Google when rendering a site, potentially resulting in the render being broken or missing data.
Make sure to check that no JavaScript is being blocked in robots.txt.
Script loading
When JavaScript files are included on a page, the order of loading is important.
If too many files are being retrieved before the user-facing content, it will be longer before a user sees the site, impacting usability and increasing bounce rate. An efficient script loading strategy will help minimise the load time of a site.
- Direct method: <script src=”file.js”>
The direct method will load the file there and then. The file is fetched, downloaded or retrieved from cache (this is when it appears in the devtools ‘Network’ tab), and then parsed and executed before the browser continues loading the page.
- Async method: <script async src=”file.js”>
The async method will fetch the file asynchronously. This means it will start downloading/retrieving the file in the background and immediately continue loading the page. These scripts will run only when the rest of the page is done loading.
- Defer method: <script defer src=”file.js”>
The defer method will fetch the file asynchronously as with the async method, but it will run those scripts immediately when they’ve been fetched, even if the page hasn’t finished loading.
So, which of these methods is best?
Classic SEO response, it depends. Ideally, any script that can be async/defer should be so. Devs can determine which is most suitable depending on what the code does, and may be persuaded to further break down the scripts so they can be more efficiently handled one way or the other.
Both types can generally be placed in the main <head> area of the HTML since they don’t delay content load. Loading via direct method is sometimes unavoidable but as a rule should happen at the end of the page content, before the closing </body> tag. This ensures that the main page content has been delivered to the user before loading/running any scripts. Again, this is not always possible (or desirable) but something to be mindful of.
Review third party script impact
Sites will often pull in third party scripts for a variety of purposes, most commonly this includes analytics and ads resources. The sticking point is that these often load their own additional scripts, which in turn can load more. This can in principle be reviewed via devtools network data, but the full picture can be tricky to grasp.
Luckily, there’s a handy tool that can visually map out the dependencies to provide insight into what’s being loaded and from where: The goal here is to establish what’s being loaded and spot opportunities to reduce the number of third party scripts where they are redundant, no longer in use, or unsuitable in general.
Steps:
- Visit WebPagetest
- Ensure that ‘Site Performance’ test is selected
- Enter URL and click ‘Start Test’
- On the results summary page, find the ‘View’ dropdown
- Choose ‘Request Map’
5. Be aware of situational JavaScript issues
JS Frameworks
You’ll doubtless have encountered one or more of the popular JavaScript frameworks kicking around – React, Vue, and Angular are prominent examples.
These typically rely on JavaScript to build a website, either in part or entirely, in the browser, as opposed to downloading already-built pages.
Although this can be beneficial in terms of performance and maintenance, it also causes headaches for SEO, the most typical complaint being that it means more work for Google to fully render each page. This delays indexation – sometimes considerably. Many in the SEO community take this to mean “JavaScript = bad” and will discourage the use of frameworks. This is arguably a case of throwing the baby out with the bathwater.
A very viable alternative is to use a service like Prerender. This will render and cache your site for search engine crawlers so that when they visit your site they see an up-to-date and complete representation of it, ensuring speedy indexation.
Infinite scroll
Infinite scroll tends to be janky and not as solid as pagination, but there are right and wrong ways of doing it.
Check any URLs that are likely to feature pagination, such as blogs and categories, and look for pagination. If infinite scroll is being used instead, monitor the URL bar while scrolling through each batch of results – does the URL update to reflect the ‘page’ as you scroll through?
If so, this is good enough for Google and should be crawled properly.
If not, this should be fixed by the devs.
URL updates should ideally be implemented in a “clean” way like ?page=2 or /page/2. There are ways to do it with a hash (like #page-2), but Google will not crawl this currently.
Routing
If a JavaScript framework (e.g. React, Vue, Angular) is in use, check with Wappalyzer. There are a couple of URLs that you’re likely to see:
- https://www.website.com/pretty/standard/route
- https://www.website.com/#/wait/what/is/this
- https://www.website.com/#!/again/what
The hash in the second and third examples can be generated by JavaScript frameworks. It’s fine for browsing but Google won’t be able to crawl them properly.
So if you spot # (or some variation of this) preceding otherwise “correct” looking URL segments, it’s worth suggesting a change to a hashless URL format.
Redirects
JavaScript redirects should be avoided in general. Although they will be recognised by search engines, they require rendering to work and as such are sub-optimal for SEO.
You can check for these by running a Screaming Frog crawl with JavaScript rendering enabled and reviewing the JS redirects under the JS tab/filter.
There may be instances where some specific JS-driven feature necessitates a JS redirect. So long as these are the exception rather than the rule, this is fine.
Conclusion
Javascript can pose issues for SEO, but these can be minimised by carefully understanding and auditing the key potential problem areas:
1) How reliant a site is on JavaScript
2) Whether JavaScript assets are being cached/updated appropriately
3) What impact is JavaScript having on site performance
4) Whether JavaScript files are being fetched correctly and efficiently
5) Situational JavaScript issues, such as infinite scroll routing and redirects
If you have any questions about JavaScript auditing or SEO, don’t hesitate to contact us – we’d be happy to chat.


