How it’s split
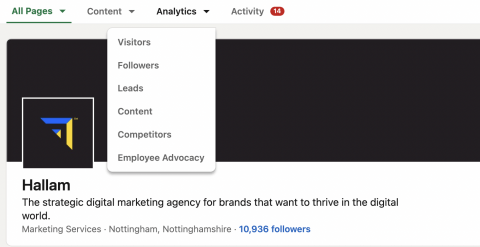
To access LinkedIn analytics, you must be an admin of the company page you’re looking to find more information on. When on your business page, click the drop down menu titled ‘Analytics’ at the top of the page and choose an option. LinkedIn separates its native analytics into six main sections:

What do these sections mean for you? Let’s take a look at each in more detail below.
Visitors

This section concerns the traffic of people that land on your company page. You’re able to toggle the date range here and have the option to export the information, too, in the top right. The LinkedIn visitor analytics page is split into three sections:
- Visitor highlights
- Visitor metrics
- Visitor demographics
Visitor highlights
This is an overview of visitors to your page within the date range you choose to specify compared to the previous period. You can see what affect your recent activity is having on how many page views there have been, unique visitors and custom button clicks.
Visitor metrics
This section allows you to dig deeper into the above page views and unique visitors – toggle between them using the first option. You can then filter the pages to specific ones or view all pages at once. Use the tick boxes to show either or both devices of desktop or mobile traffic.
The way you view your metrics will all depend on your primary LinkedIn aim. So it’s important to understand your goals before digging into the analytics.
Visitor demographics
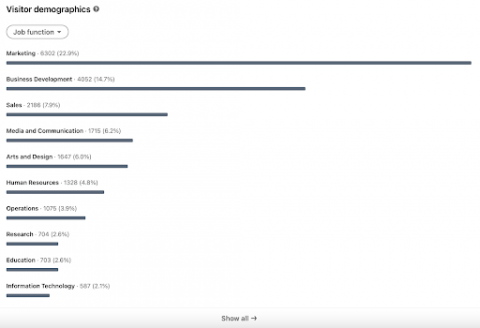
This section gives you the demographics of all the users to your page over the time range of your choosing. The demographic information identified can be toggled to show either job function, company size, industry, location or seniority. Simply choose from the dropdown box.
This information shows an overview of the type of people and profiles visiting your LinkedIn page. To ensure you are providing value to your audience, you should use this data to decide which content you create and make it a fundamental part of your content creation sessions.
Followers
This section gives you metrics concerning your page’s followers. As with the visitors section, use the options to define your date range. You can also export this data if you want to.
The LinkedIn followers analytics page is divided into four parts:
- Follower highlights
- Follower metrics
- Follower demographics
- All followers
Follower highlights
The above section gives an overview of your follower highlights according to the date range you’ve stated – including total followers and new ones compared to the previous period. This section gives you a good indication of follower growth and how well your company’s network is expanding.
Follower metrics
This gives you an overview of new follower activity over your chosen time range. You can use the tick boxes to choose to show followers gained through sponsored activity, organic activity or both.
This metric can be useful to see what day or time range you gained the most followers. Compare this to the rest of your activity and the content you have been sharing over the same period – you may find certain types of posts tend to have a positive impact on new followers.
Follower demographics
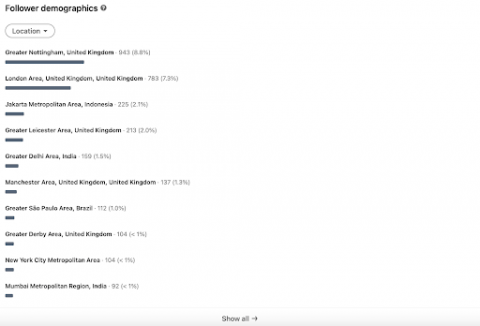
This area allows you to understand the aggregated demographics of your page followers. Similar to the visitor metrics, this section can be adapted for the following data sets: job function, company size, industry, location or seniority.
As well as comparing this data to your visitors, you can also use your follower demographics to create reliable user personas for your business. See how you can use your user personas to create effective content here.
All followers
This feature allows you to see a list of your page’s current followers ordered by recency. You’ll see their profile down the left along with their picture, degree of connection to you and their job title. On the right, you’ll see the month they followed your company page.
Leads
If you have lead generation forms activated on your company’s profile, here is where you’ll find information about any leads collected over the last 90 days. It will show how many leads you’ve had in total and the amount of new ones in the last 30 days. The download column enables you to download these leads to use elsewhere in your business.
Updates
This section concerns your activity on LinkedIn and shows your post metrics. It’s broken down into three areas:
- Update highlights
- Update metrics
- Update engagement
Just like before, you’re able to stipulate your date range and download the data if you wish.
Update highlights
This is an overview of your page highlights from a date range you have set compared to the previous period. Check this to see if your recent activity is having a positive or negative effect on your post likes, comments and shares.
Update metrics
Here you can see key metrics generated by your updates that are visibly split between organic and sponsored – just use the tick boxes that follow the graphs to view them. You’re given the option to explore key metrics through selecting them on the dropdown menu. They include: impressions, unique impressions, clicks, reactions, comments, shares and engagement rate.
Similarly to the visitor and follower graphs, looking at the metrics here for your activity and individual posts is often a good indicator of their success. Visually you’re able to see a specific metric and its performance over time – you’re aiming for an upward trajectory or something that stays continuously steady.
Update engagement
This section is great for more granular details on specific posts. It’s updated in real time and controlled specifically by its own date range toggle: note that data on video performance is limited to the last 6 months. You can see ten posts in separate rows initially (you can choose to see 20 rows as an alternative) while you’re able to click through the pages to see more of them.
You‘ll see the update title on the left, who it was posted by and the date it was posted. The table that follows shows important information and key performance indicator values about the precise post you’re looking into. Post type, audience, impressions, views, clicks, click-through-rate, reactions, comments, shares, follows and engagement rate are all included.
Competitor analytics
In this area, you can see how your company page is performing on LinkedIn in comparison to other pages on LinkedIn – particularly your competitors. You can manage your competitor list through the option on the right which says ‘edit competitors’. Next to this you will see the option to export the data on this page if it’s helpful for wider reports around the business. 
As with other pages, you can set the date range and the tables will automatically generate information from the relevant competitor pages and their followers, including the running total and new ones from the time period.
The second table looks into the organic content of your competitor’s pages, showing their total engagements and the number of updates they’ve posted. 
All of these analytics are useful in helping shape your social media content plan for LinkedIn and allowing you to gauge where you fall in terms of performance in comparison with your competitors. This information allows you to assess whether to post more often or make more efforts to optimise your activity for further engagement, interaction on your profile, or to encourage new followers.
Employee advocacy
The employee advocacy section deals specifically with your company page, its updates and how it relates to and recommends content from your employees or team mates. When you have the ‘My Company’ tab enabled for employees on your business page then additional functionalities become enabled, including being able to recommend specific posts for your employees to share. LinkedIn then collates all the data and information about these shares and how much engagement and interest they gain on the platform.
Highlights for the past 30 days will show you how many recommendations have been made by you or other admins on your company page, as well as the amount of shares by your employees from these. The engagements for these are then broken down by the number of reactions, comments and shares.
Not only can this give you a good indication of how your employee advocacy programme is performing and how committed your team are to being more active on the platform, but also how interesting the wider LinkedIn audience finds your posts.
Further sections within the employee advocacy analytics section that are worth monitoring are:
- Employee advocacy metrics
- Employees posting from recommendations
- LinkedIn members reached
- Recommendation engagement
Look out for a future blog from us where we’ll explain getting started with the LinkedIn employee advocacy programme in further detail. We’ll cover setting this up for your business, engaging your teams and understanding the analytics.
Concluding thoughts
Getting to know your LinkedIn Analytics might seem like a long-winded process, but by dedicating a short period of time to it each week, it will soon become second nature and you’ll be able to utilise the data for your own benefit.
We recommend starting your journey by making a note of your primary and secondary LinkedIn goals, and then putting a weekly or monthly report together outlining the specific analytical data which directly affects those goals.
Want to know more about how we can help you increase your LinkedIn success and reach those business objectives? Get in touch today and a member of our social media team will be more than happy to chat about how we can support you.


